Analysis / / 7 min read
How accurate are IHME models in Sweden?
Examining Sweden’s COVID-19 data and the accuracy of early IHME projections.
Originally published on Medium ↗
I recently read the article “How Fear, Groupthink Drove Unnecessary Global Lockdowns” by Yinon Weiss published on realclearpolitic.com. I am writing this as my attempt to examine specific claims in the article using publicly available data files from IHME. I wrote a Jupyter Notebook in python to recreate the chart in question using IHME data, analyzed trends in the models accuracy and highlight issues specific to Sweden that do not appear to apply to other locales. My notebook and code is available on github here.
Part of Mr. Weiss’s claim that COVID-19 lockdowns were unnecessary is the use of modeling data to make decisions. He is not the first to make a critique of IHME methods, including a study in Annals of Internal Medicine. In the article he specifically calls out the IHME model for Sweden as being inaccurate, over predicting deaths and detrimental to decision making.
One of the most well-known and respected models in the United States is from the Institute for Health Metrics and Evaluation and is commonly cited by the White House. Since the IHME model accounts for lockdowns and social distancing, or lack thereof, they should be validated by their predictions on Sweden.
I became interested in this point because of the chart Mr. Weiss presents as evidence, which appears to show the IHME model over-predicting deaths in Sweden on May 3. Mr Weiss uses this models performance over the two weeks following the prediction to show how far off it is. Here is the chart posted by Mr. Weiss.
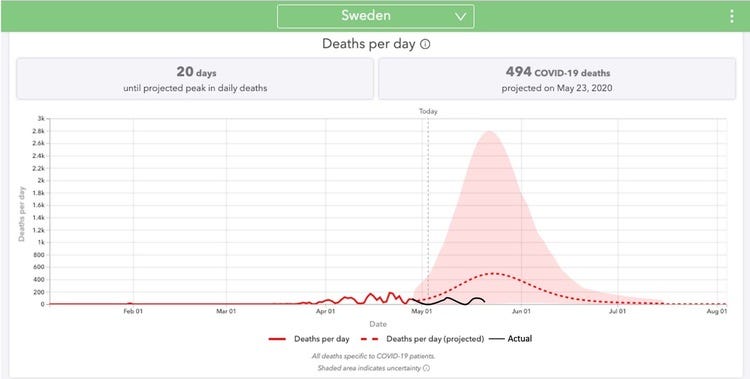
Image published in “How Fear, Groupthink Drove Unnecessary Global Lockdowns”
At first look I noticed two things I wanted to investigate with this chart and the narrative it suggests-
First, Mr. Weiss says that this graphic is “a screenshot of the IHME model for Sweden taken on May 3, along with actual results (black line).” It is not clear how the black line was drawn, or from what data, but it is clear this is not part of the original screenshot or IHME released content. This “sharpie” approach to annotating the data doesn’t give the reader any idea where the extra data came from, and I would argue misleads them into thinking it is part of the IHME published data.
Second, the very specific choice of May 3rd struck me as odd, given that IHME releases models fairly regularly and the date of publication for this article was May 21. This is not a completely unreasonable choice given he wanted 2 weeks of actual data, however it made me wonder why that date. A problem I often find with arguments for and against lockdowns is that they seem to have cherry-picked the dates that show a specific narrative. Models fluctuate over time and it is easy to find a single instance to support nearly any narrative.
I have been looking at various instances of IHME models as I have been curious about how they over predict or under predict for specific US states over time. In early April a paper “Learning as We Go: An Examination of the Statistical Accuracy of COVID19 Daily Death Count Predictions” highlighted the type of systematic errors that seem to creep into the IHME model.
So the problem I set out to solve was to recreate the chart used by Mr. Weiss using IHME data. I wanted to analyze for IHME predictions in Sweden and other locales over time. My approach was to download all IHME historical model data and analyze and chart it. When loading the various prediction datasets I added the publication date to each, allowing me to look at various statistics over time for different locales.
My first approach was to see how much variability exists in the prediction data over time generally. I was looking to see if the model was stable and putting out consistent projections. In my experience creating any kind of model you often encounter new circumstances over time that lead to model “thrash” where predictions fluctuate significantly based on relatively small changes. This tends to occur in many weather models — if you’ve ever seen the “possible” tracks of a storm and noticed how some show it out to sea while others show it with a direct hit on a major city with hundreds of miles of variation, then the next day it seems to pinpoint a location.
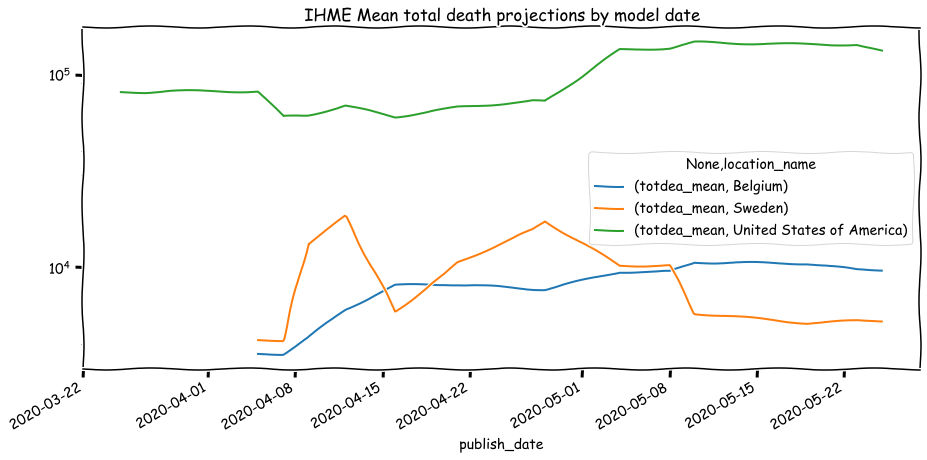
In this chart I compared stability of projections for 3 countries — Sweden, United States of America and Belgium. The exact numbers in this chart aren’t important, rather it is the degree of change over time that matters. Here we can see the United States line is fairly flat, with the mean total death projection having relatively little variation over time. In the case of Sweden, we can see some pretty dramatic ups and downs in the line, indicating that the prediction changed significantly in different model versions. We can also see that one of the “peaks” of this line is approximately April 28, with future models predicting successively lower total death counts.
Next I tried to reproduce the chart from Mr. Weiss containing the “sharpie” annotation of death data. To do this I took the IHME predictions from April 28, the closest previous date to the May 3 screenshot, and included the actual deaths reported until May 21 as his chart does. In theory this would be the same data he used and my “actual” and his “actual” lines should match.
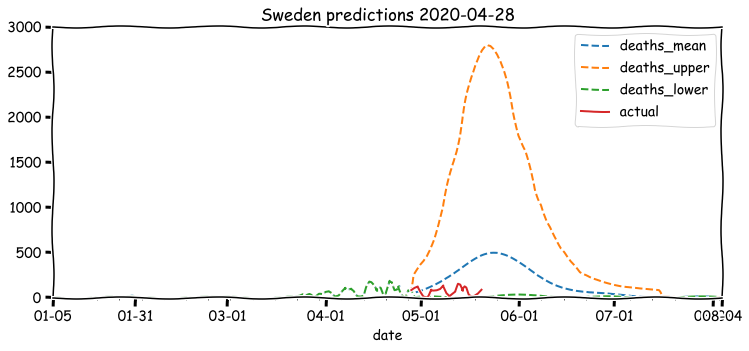
Jupyter Notebook generated IHME model data for 4/28/2020 including actual data up to 5/21/2020
Comparing these two lines I would say that they are closer than I expected, however it does seem to me Mr. Weiss line is not fully based on the same actual data. There is a lot of room for differing opinions here, but I think it’s worth noting they are in the same order of magnitude and illustrate the same point — the IHME model published on 4/28/2020 was over predicting deaths in Sweden. It’s possible he used data that was smoothed or from another source, which is not stated in his article. Here are the two small sections of chart stacked for comparison, lined up as best I can with my version on the bottom and Mr. Weiss version on the top.
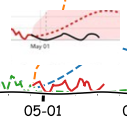
Comparison of the two charts “actual” data lines approx. May 1 — May 21
Finally I wanted to look at how the dates used by Mr. Weiss might impact the conclusions a reader might draw. Undeniably, the chart used by Mr. Weiss shows a model over predicting deaths relative to the actual numbers. In the sequence of three charts below I show what the IHME model data would have looked like one week before, at and about one week after the article.
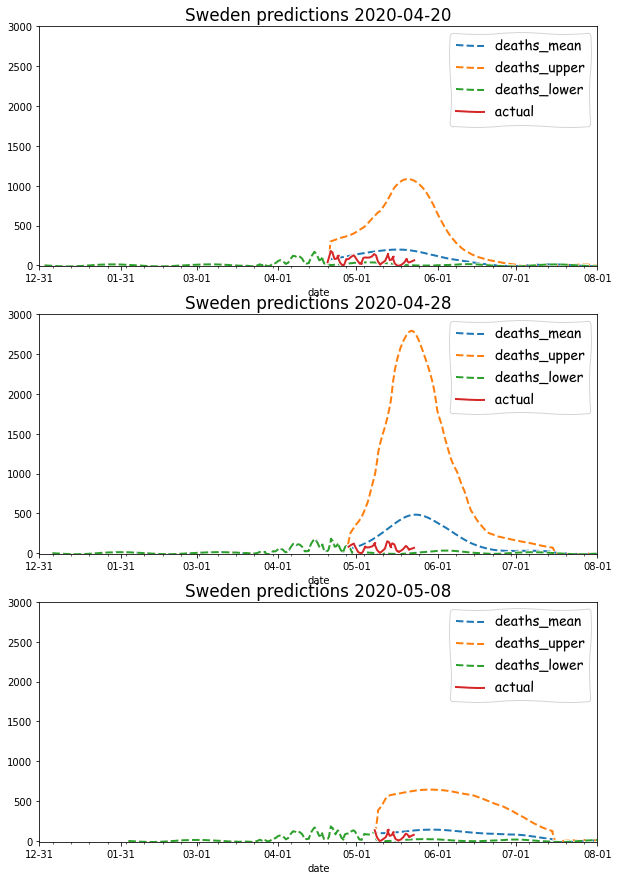
Three different sets of predictions by IHME models over time
My conclusion from these 3 stacked charts is that the IHME model for Sweden performed reasonably well for 4/20 and 5/8, however it was significantly off for 4/28. My best guess is that the screenshot captured on 5/3 was based off the 4/28 data since the next model was not published until 5/4. It is my understanding that in the IHME model, the deaths_upper and deaths_lower represent their 95% confidence interval for a prediction. In all 3 cases the actual data falls within that confidence interval. My takeaway from this is that using any single model run would be imprudent to make decisions, however the models perform within the expected range over time.
Additionally, the April 28 model run used is Mr. Weiss article is the worst performing of all Sweden predictions. This could be a complete coincidence and I’m not claiming malfeasance on the part of Mr. Weiss. I think a more reasonable approach to using the prediction data would be to take into account other predictions and their accuracy rather than select a single model, since there is a lot of variation between individual models.
As a final point of comparison I ran the same sequenced charts for the United States of America, which from my first chart at the beginning of the article, showed a more consistent prediction output.
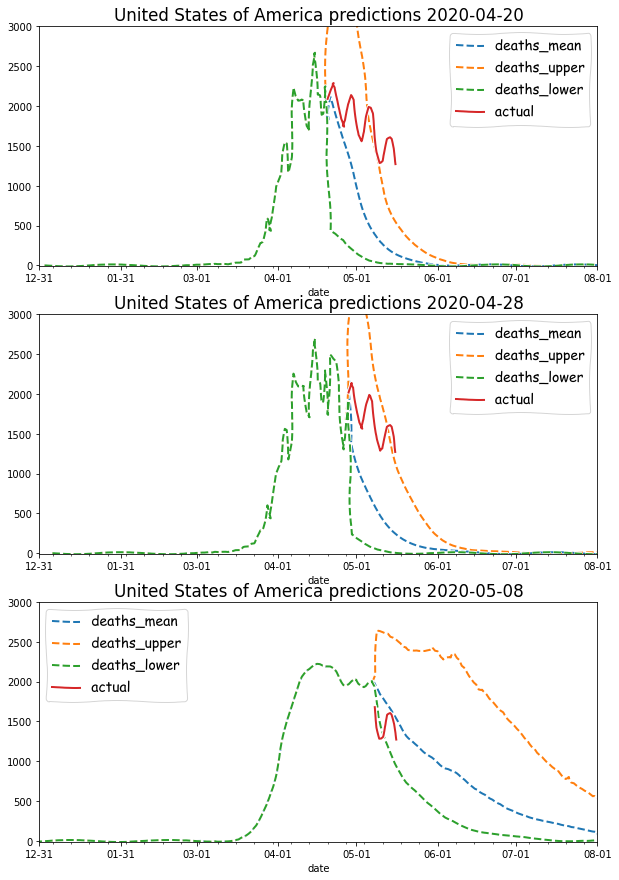
What is striking on this graph is that the model has the opposite problem from Sweden — it under predicts the actual deaths in two out of the three weeks. Not only does it under predict, the actual deaths fall above the 95% confidence interval. This suggests the models for the United States were too conservative in their death predictions generally, but have improved over time.
In conclusion, I found that the IHME chart presented by Mr. Weiss regarding IHME data appears not to have been based on IHME data and was potentially misleading based on his claim of it being a “screenshot”. Analysis of the Sweden model over time suggest the specific date used of 5/3/2020 was among the worst performing model dates. Further, the IHME model appears to under predict in other countries like the United States, seeming to negate the argument that the model is overly pessimistic.